


How do the controversial figures from JRC (Joint Research Centre) over harvested areas in Sweden correspond to the official Swedish statistics? We asked the GIS expert Anton Holmström to analyze how data from JRC/GFC corresponds to Swedish forestry data. The result shows that the official Swedish forestry statistics may underestimate Sweden’s harvesting level, but also that it’s not all about clear-cuts.
This is an article signed Fredrik Reuter at iSkogen.se, translated by Per Jonsson and Fredrik Reuter.
Table of Contents
How does the harvested forest area correspond between JRC and Swedish Laser Data?
Our analysis shows that JRC’s data from GFC (Global Forest Change) on average detected 15 percent more felled area than the Swedish National Forest Inventory (NFI) during 2016 – 2018. Most of the GFC areas (approx. 85 percent) are classified as clear-cuts in the analysis. The results are based on areas over 0,5 hectares and solely on forest land in Sweden.
On average per year and area, the result for 2016 – 2018 (three years) show that GFC finds 30.000 hectares more harvested forest area than the Swedish National Forest Inventory. Recalculated to volume in clear-cuts, that could correspond to approx. 3 million cubic meters.
JRC’s article in Nature
On the 1st of July 2020, the magazine Nature published an article from JRC, “Abrupt increase in harvested forest area over Europe after 2015”. In the article, JRC claims that through satellite data they have found that the harvested forest area has increased by 49 percent between 2011 – 2015 and 2016 – 2018.
The reactions to the article were massive, to say the least, especially in Sweden and Finland where some of the largest increases in harvested forest areas were found. To present all the criticism the article and JRC received is too much in this context and for this article. But the criticism was massive and came from, among others, SLU (Swedish University of Agricultural Sciences), Chalmers University of Technology, the Swedish Forest Agency, and EFI (European Forest Institute), who claimed that the article was wholly or partly false.
In May 2021, JRC responded to the criticism. They admitted that there were errors in the article and adjusted the figures (from the above-mentioned 49 percent to 35 percent). According to JRC, it’s about unknown errors that the calculation of satellite data improves over time. Furthermore, new satellites with better technology have been taken into use. The new ones provide more accurate data.
The criticism against JRC took overhand
In June 2022, the issue doesn’t seem to be settled. Academic deadlock seems to have taken over. The two sides sit in their trenches whereas JRC in Italy likely tests Sentinel data on a large scale. In the meantime, the Finns and the Swedes load their shotguns with even more R-files. Both sides probably mumble “ok, you can do it like that, but it’s not right”.
How good or bad are the data from JRC/GFC?
Paradoxically enough, the consensus seems to prevail concerning that the input data after 2015 is “better” and catches more changes. It is also at this starting point this article comes in.
The reason is that the massive criticism only has focused on the fact that you can’t compare the specified years as described above. This criticism seems to have taken away the oxygen in the debate and unfortunately also other important issues like how good or bad the data from JRC/GFC really is. Consciously or not by the critics, we want to ask; How good is the satellite analysis and what is it good for?
Analyses based on remote sensing are here to stay. Most likely, it will be the dominating method in forest measurements in the future. As an example, the Swedish Forest Agency uses a similar method, Sentinel, to discover new clear-cuts by satellite. A method that has been used for over 20 years. With this fresh in mind, we asked the GIS expert Anton Holmström to have a closer look at data from JRC and GFC and compare them with other available data sources.
How was this analysis done?
The idea was to evaluate the data set from GFC used by JRC to discover strengths and weaknesses in the satellite analysis and compare it to other available data. To evaluate the accuracy, it takes lots of field visits which is a vast job if you want to make it as accurate as possible. Instead, we chose to evaluate GFC detections with other open and landscape-covering data. As consensus seems to prevail that GFC got better after 2015, we chose to study this data.
We picked up GFC data for 2016 – 2018 (loss year), Basic Forest Data (“Skoglig Grunddata” (SGD) from the Swedish Forest Agency), and statistics over harvested forest areas from the Swedish National Forest Inventory. Furthermore, we requested historical data for registered harvested forest areas from the Swedish Forest Agency. This is GIS data used by the Forest Agency to keep an eye on how much and which areas are harvested as clear-cuts in Sweden. As for the Forest Agency, we took data from 2015 to 2019 to receive an overlap as some areas could have been registered at different times.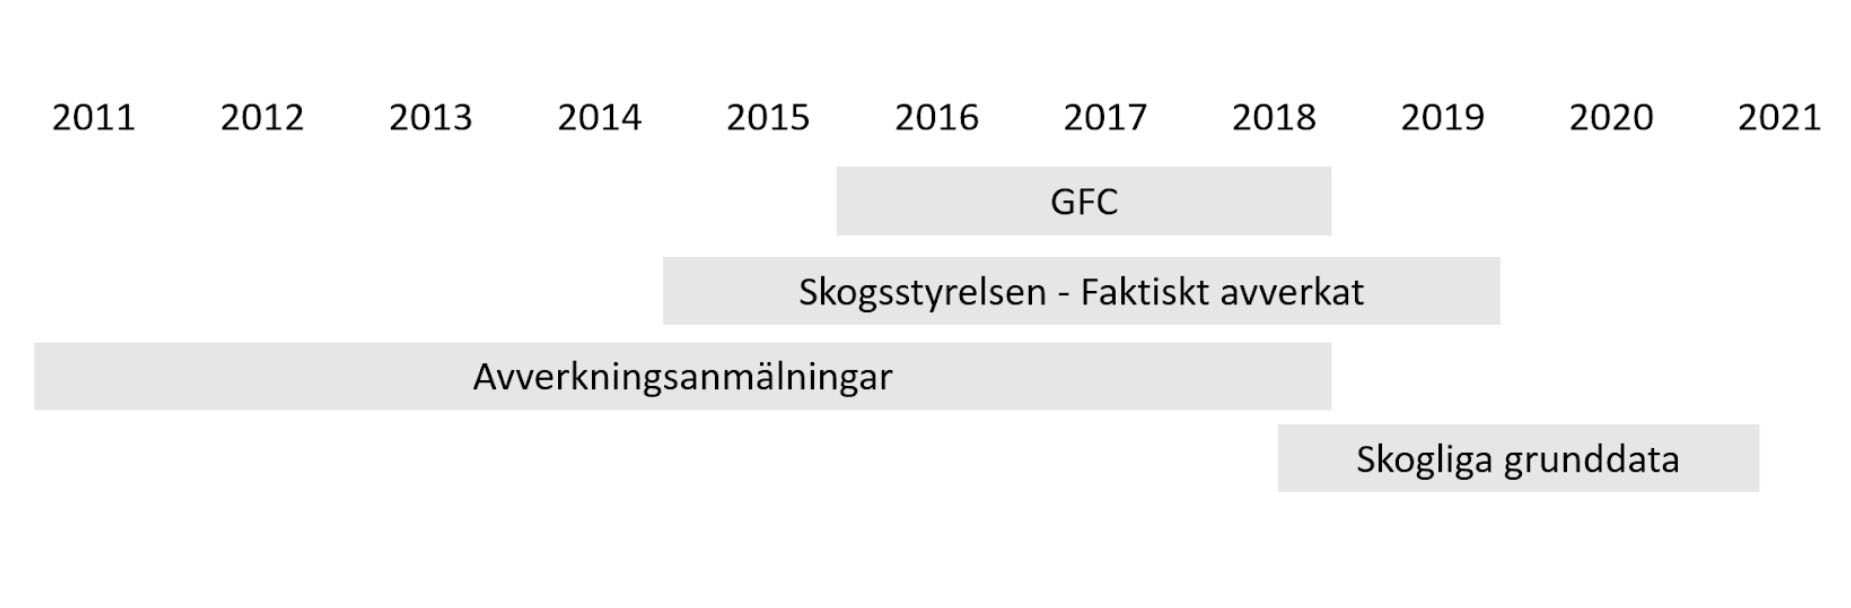
All data has been processed with the software QGIS. When you have entered the data from all sources you can calculate areas and of course compare layers with each other. The main comparison is made to data from the National Forest Inventory. The reason for that is explained later in this article.
It’s a relatively simple setup where the purpose was to start digging deeper into the GFC data. The analysis is not the total truth, but to avoid overly optimistic calculations we have chosen to use the principle of the benefit of the doubt whenever uncertainties have occurred in the analyses. In the case of uncertainty of when a harvested forest area has been discovered and registered, we have for the Forest Agency’s “Actually felled” (“Utförd avverkning”) chosen to prolong the timeframe to one year before and one year after the GFC areas. The analysis was done according to the flowchart below.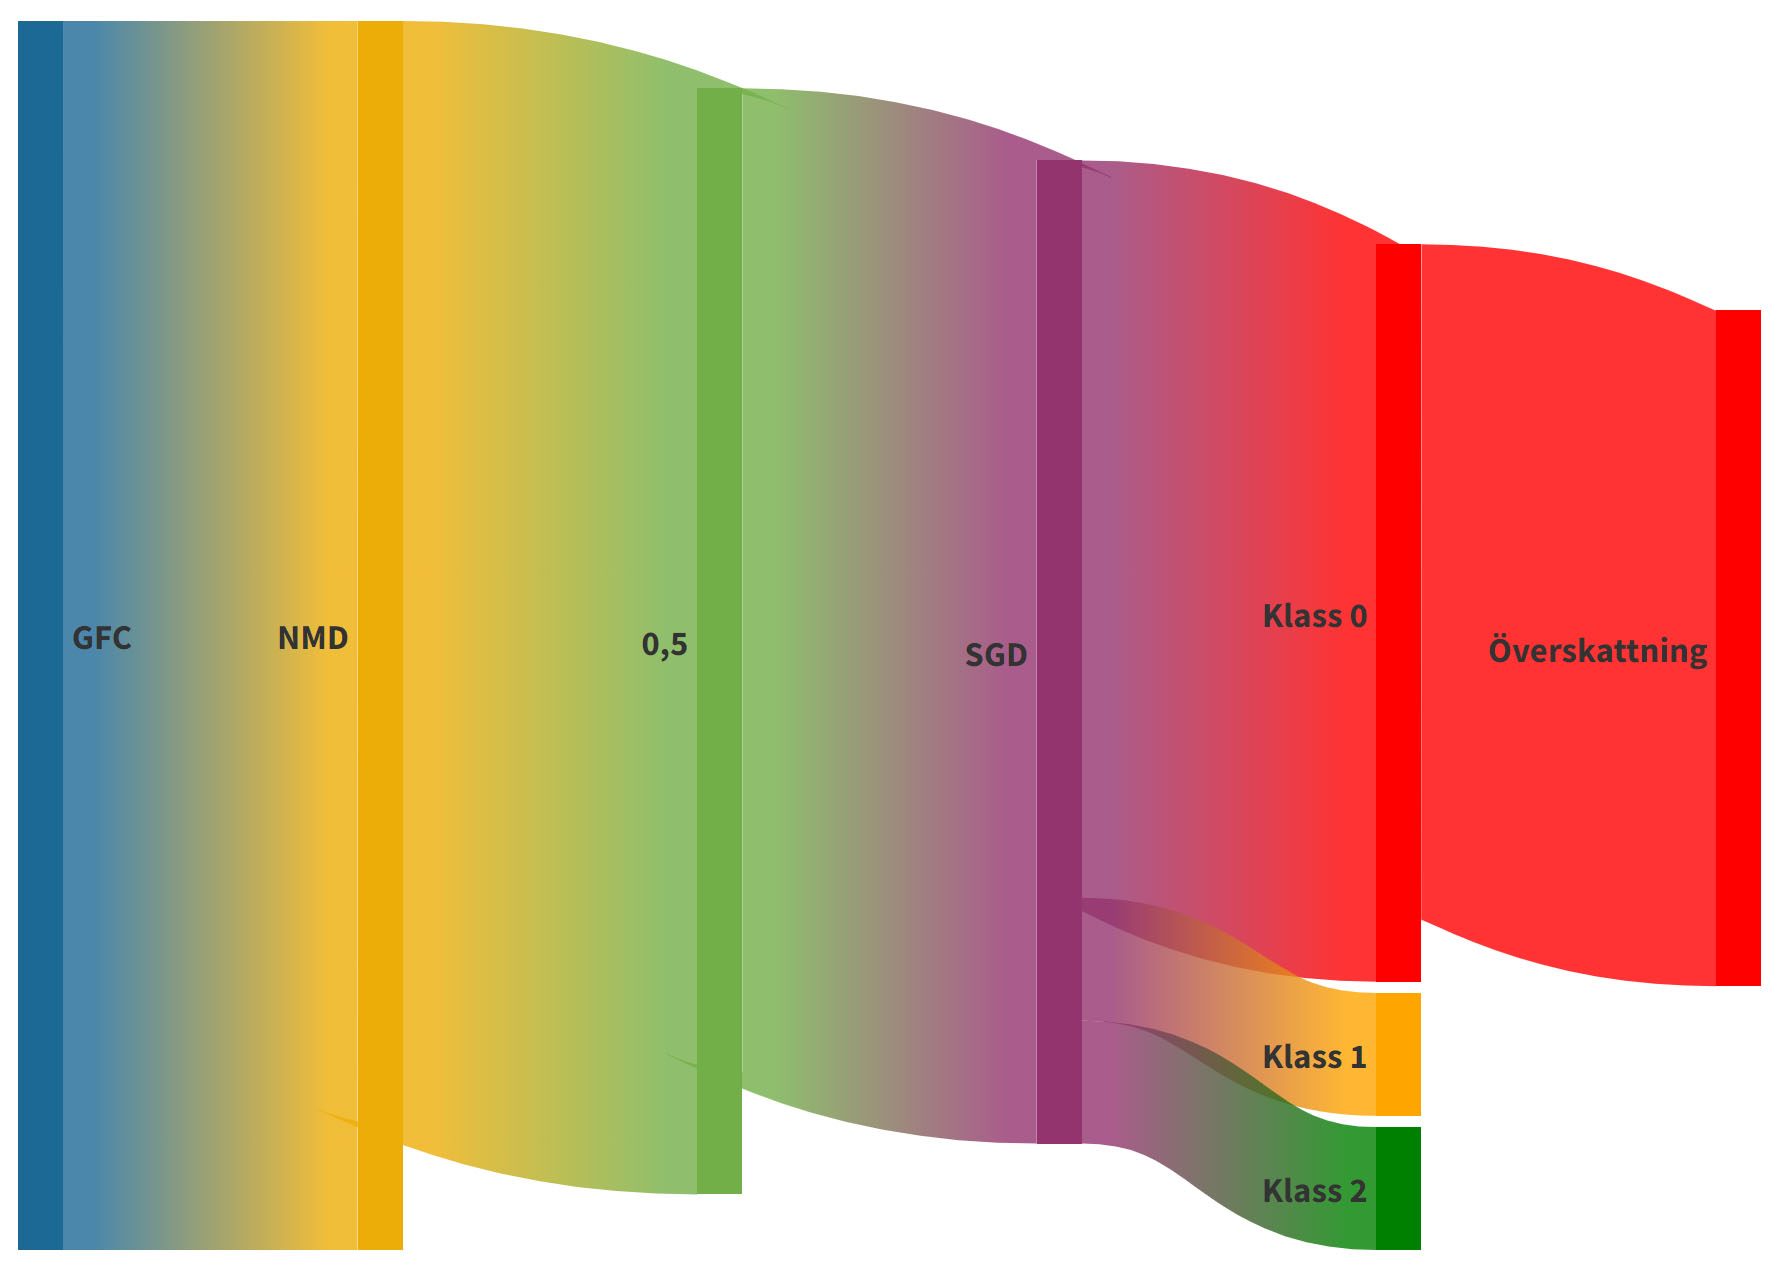
Illustration: Fredrik Reuter
For the registrations of harvested forest areas, we chose to include all registrations that most likely were valid, namely registered up to five years before 2016.
“Basic Forest Data” (“Skogliga GrundData”, SGD), the second scan, started in 2018 which leads to that some GFC sites are already harvested, and that SGD was collected just before the harvesting operations. In our analysis, those sites are therefore noted as “not felled”, which in this case contributes to the fact that our analysis of GFC data is underestimated.
The National Forest Inventory doesn’t offer any open GIS data so, here we use the total harvested clear-cut area as a reference. On average, this was 201.000 hectares annually between 2016 and 2018. The Swedish Forest Agency has its own, non-official statistics on these areas and their corresponding figure for the same period is approx. 180.000 hectares.
Data from GFC does not consider whether the satellite finds a potential harvested area on forest land or not. So, our first step was to merge the data with the Swedish Environmental Protection Agency’s land cover database to clear out the non-forest land areas.
There is also no lower bound and the smallest harvested forest area in GFC is 30 x 30 meters (one pixel). In total, approx. 12 percent of the GFC areas are smaller than 0,5 hectares. To simplify, and rectify with the Swedish Forestry Act, we sorted out all GFC areas larger than 0,5 hectares.
When this process was finished, a little more than 279.000 hectares of harvested forest area on an annual average during the GFC period was left. This is just over 50 percent more area than the Forest Agency’s data. Compared to the National Inventory’s data, it’s just over 28 percent more.
Now we must clarify what kind of forest activities GFC really discovers. When looking closer at the GFC areas, it’s obvious that not all areas are clear-cuts. Here we use Basic Forest Data, SGD (based on Swedish laser data). We created a mathematical function to calculate ratings with QGIS according to the Swedish Forestry Act §5 and §10. This is an analysis of who’s uncertainties depend on the input data’s uncertainties. However, evaluations of SGD show that basal area weighted mean height (HGV) shows a good result, while the stand volume, in general, is overestimated in weaker stands. It makes it likely that more stands are thus generally rated according to the principle of the benefit of the doubt.
Briefly, a raster map with three classes was created.
Class Limits/Bounds Comments
0 Under §5 Clear-cut
1 Under §10 but over §5 Clear-cut with nursing trees
2 Over §10 Ok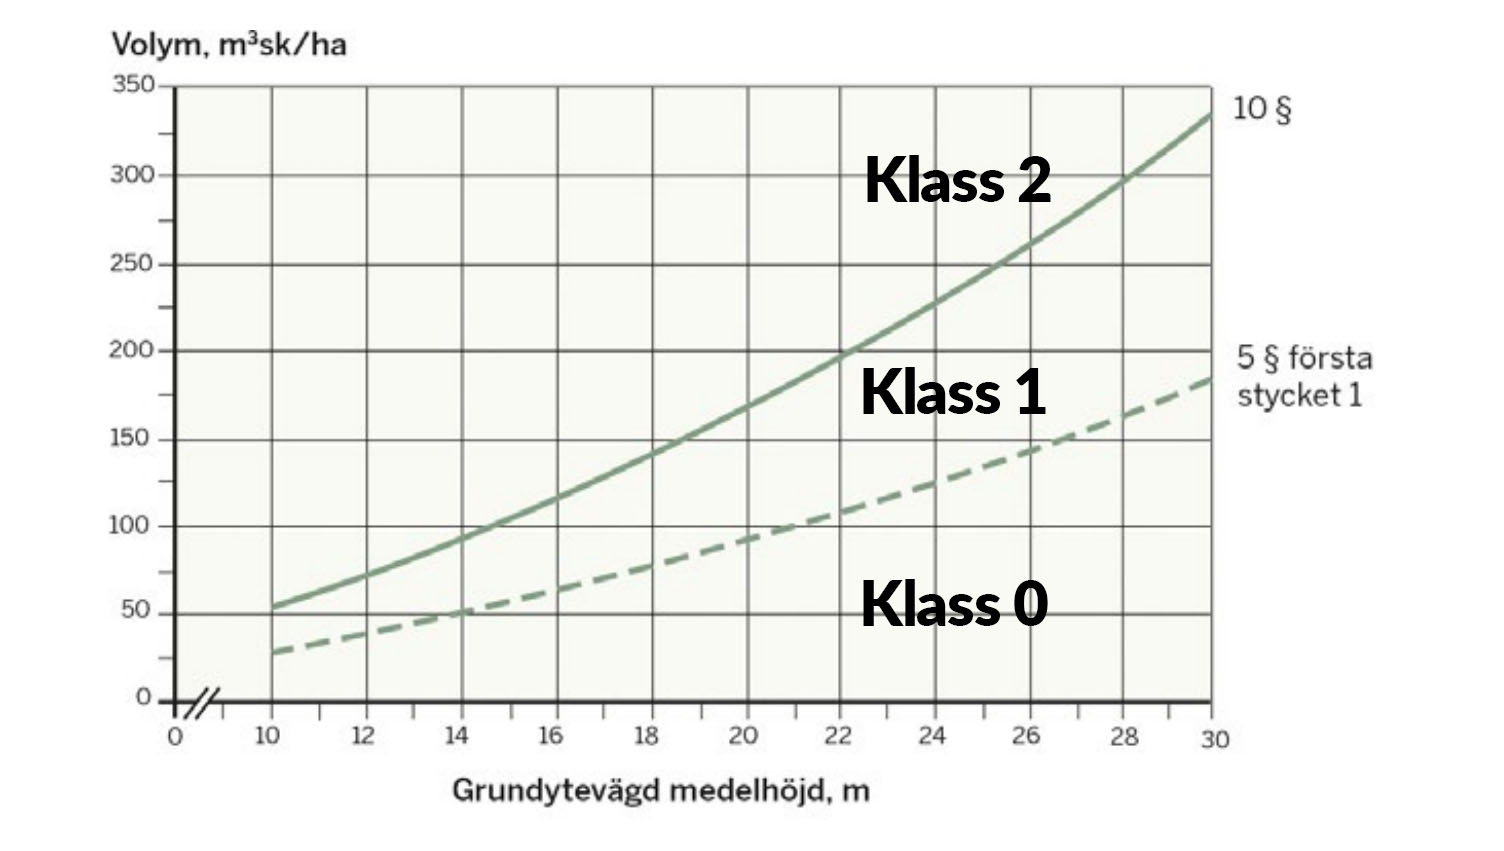
Each GFC site within the scanned area now belongs to a rating class due to what kind of SGD pixel it has in the majority. E.g., if the 0 pixels are in majority, the GFC site is under §5. Unfortunately, not all of Sweden was scanned in the second laser scanning, 57 percent of the GFC sites are found within the scanned area. If 57 percent is enough to represent all of Sweden could be discussed, but we chose this method to get a national result.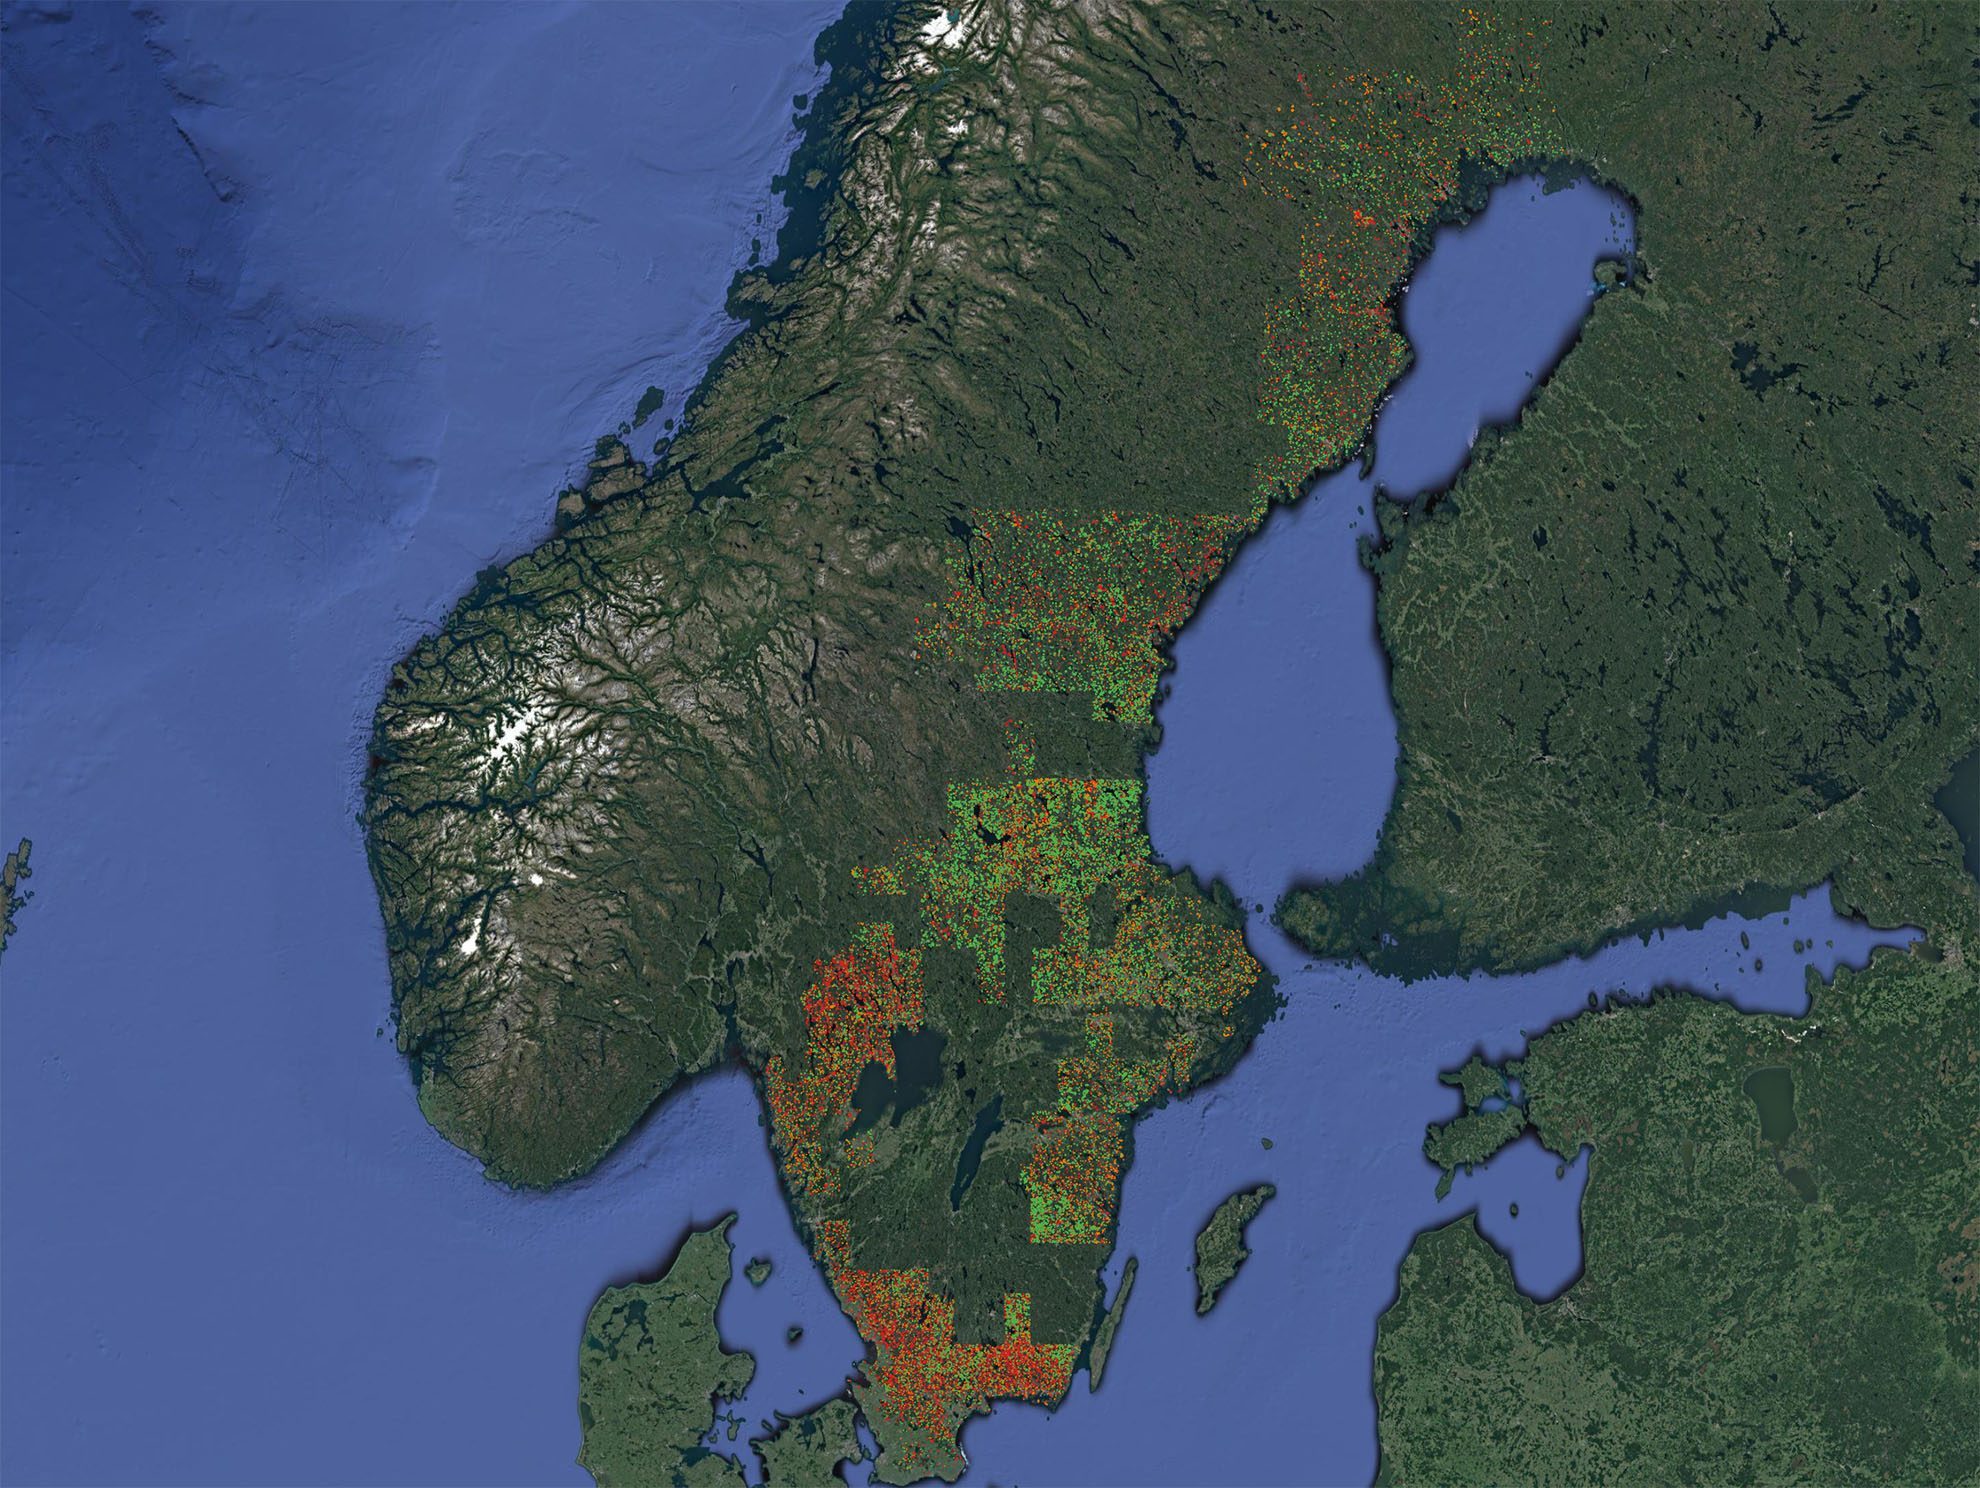
Photo: Fredrik Reuter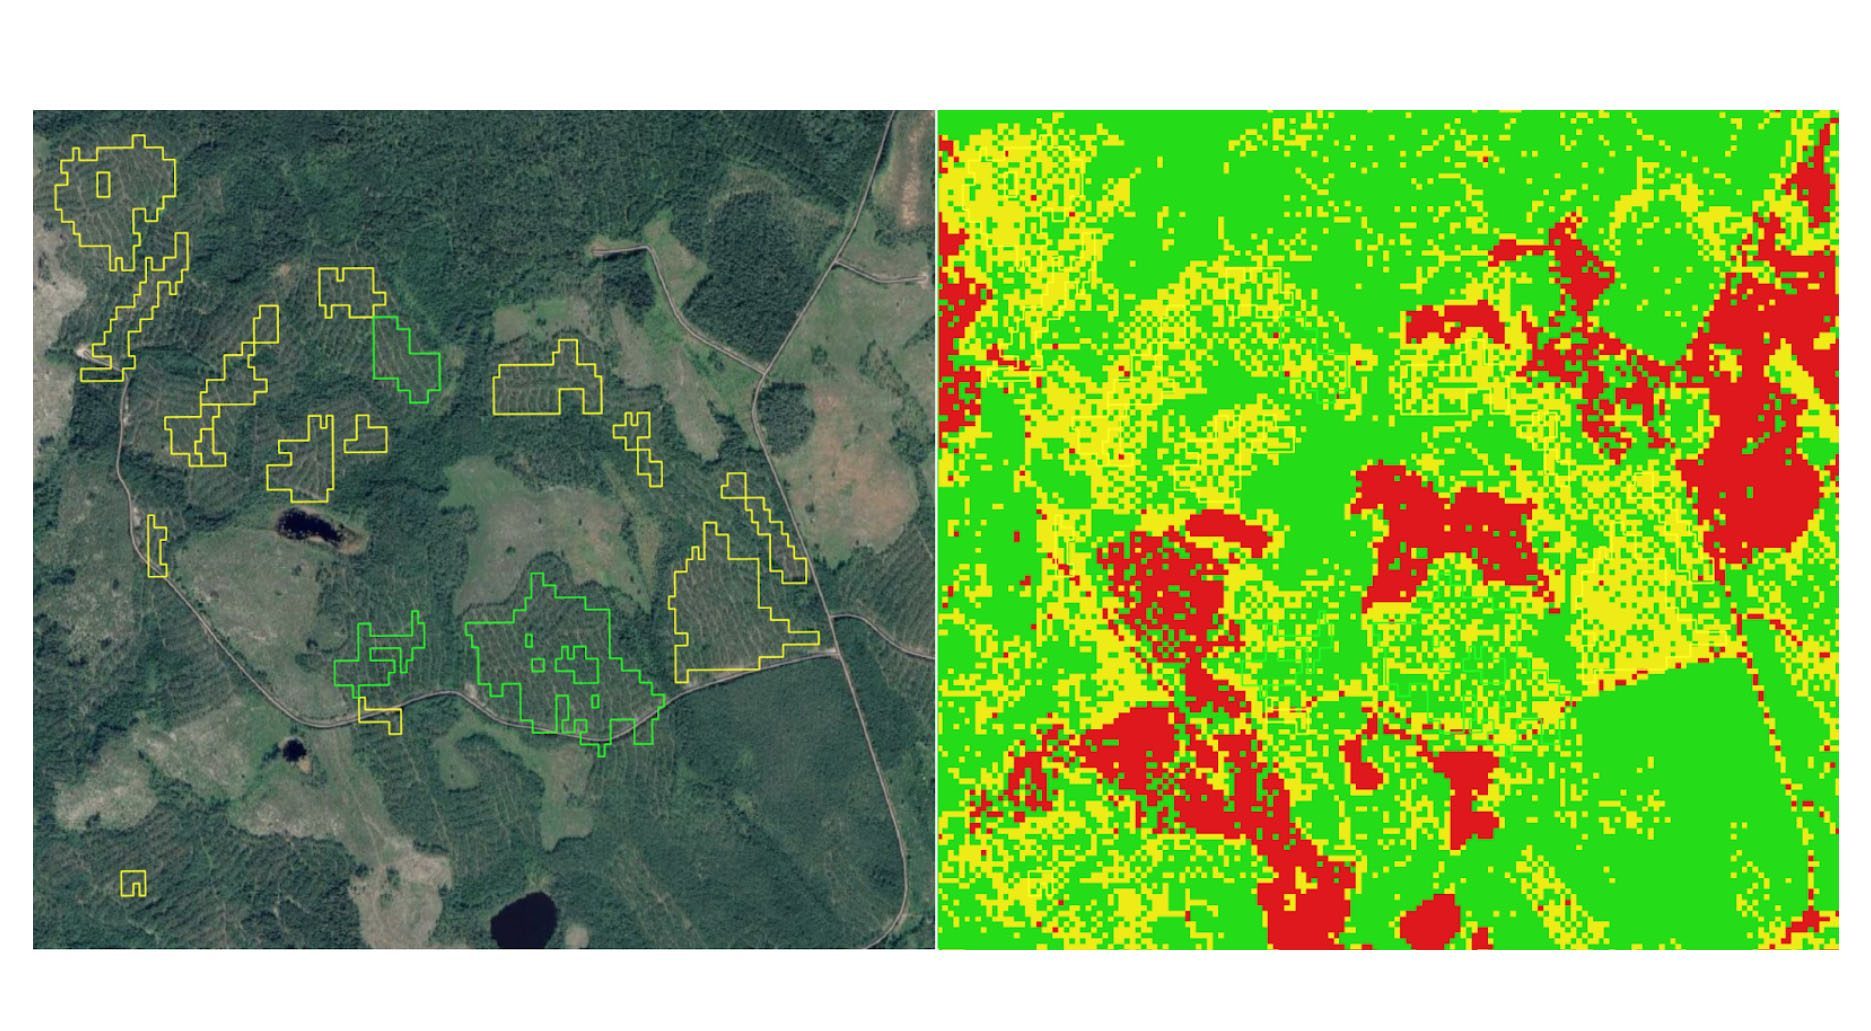
Photo: Anton Holmström
The map to the left above shows GFC sites colored according to the rating. Green is over §10 and yellow under §10. The map to the right shows pixel values from SGD, where red pixels are under §5. Please note that within the GFC sites there is a variation of pixel values where the value that is in majority within the site decides the value of the site according to our analysis and thereby the Forestry Act. Also, note that SGD discovers larger areas under §10 than what GFC does.
The result of the analysis
Within the laser scanned GFC area, approx. 85 percent is estimated to be clear-cut areas (under §5) and 7 percent of the area is over §5 but under §10, that is too hard thinning, left nursing trees, or similar that according to the Forestry Act should be registered. Note that the analysis is for GFC areas larger than 0,5 hectares.
Class Average annual area according to SGD >0,5 hectares
0 237.417 hectares
1 19.552 hectares
2 22.345
We use the area distribution per rating class for GFC areas over 0,5 hectares in all of Sweden. That gives an average harvested forest area for 2016 – 2018 of 237.417 hectares per year. Harvested forest area under §10 but over §5 is 19.552 hectares. This is however no good value as GFC both over- and underestimates the felling area.
When we worked with the GFC data we often discovered that areas are bigger (or smaller) than in reality. Therefore, we made two checks to assess the correctness of GFC’s demarcation of the areas. The demarcation includes both measuring over- and underestimation.
To get the figures for overestimation we used the Basic Forest Data, SGD, to assess how much forest there is within the areas we rated as felled. The analysis shows that approx. 15 percent of the area has forest left – an overestimation of the area. A little more than 20 percent of the area is under §10.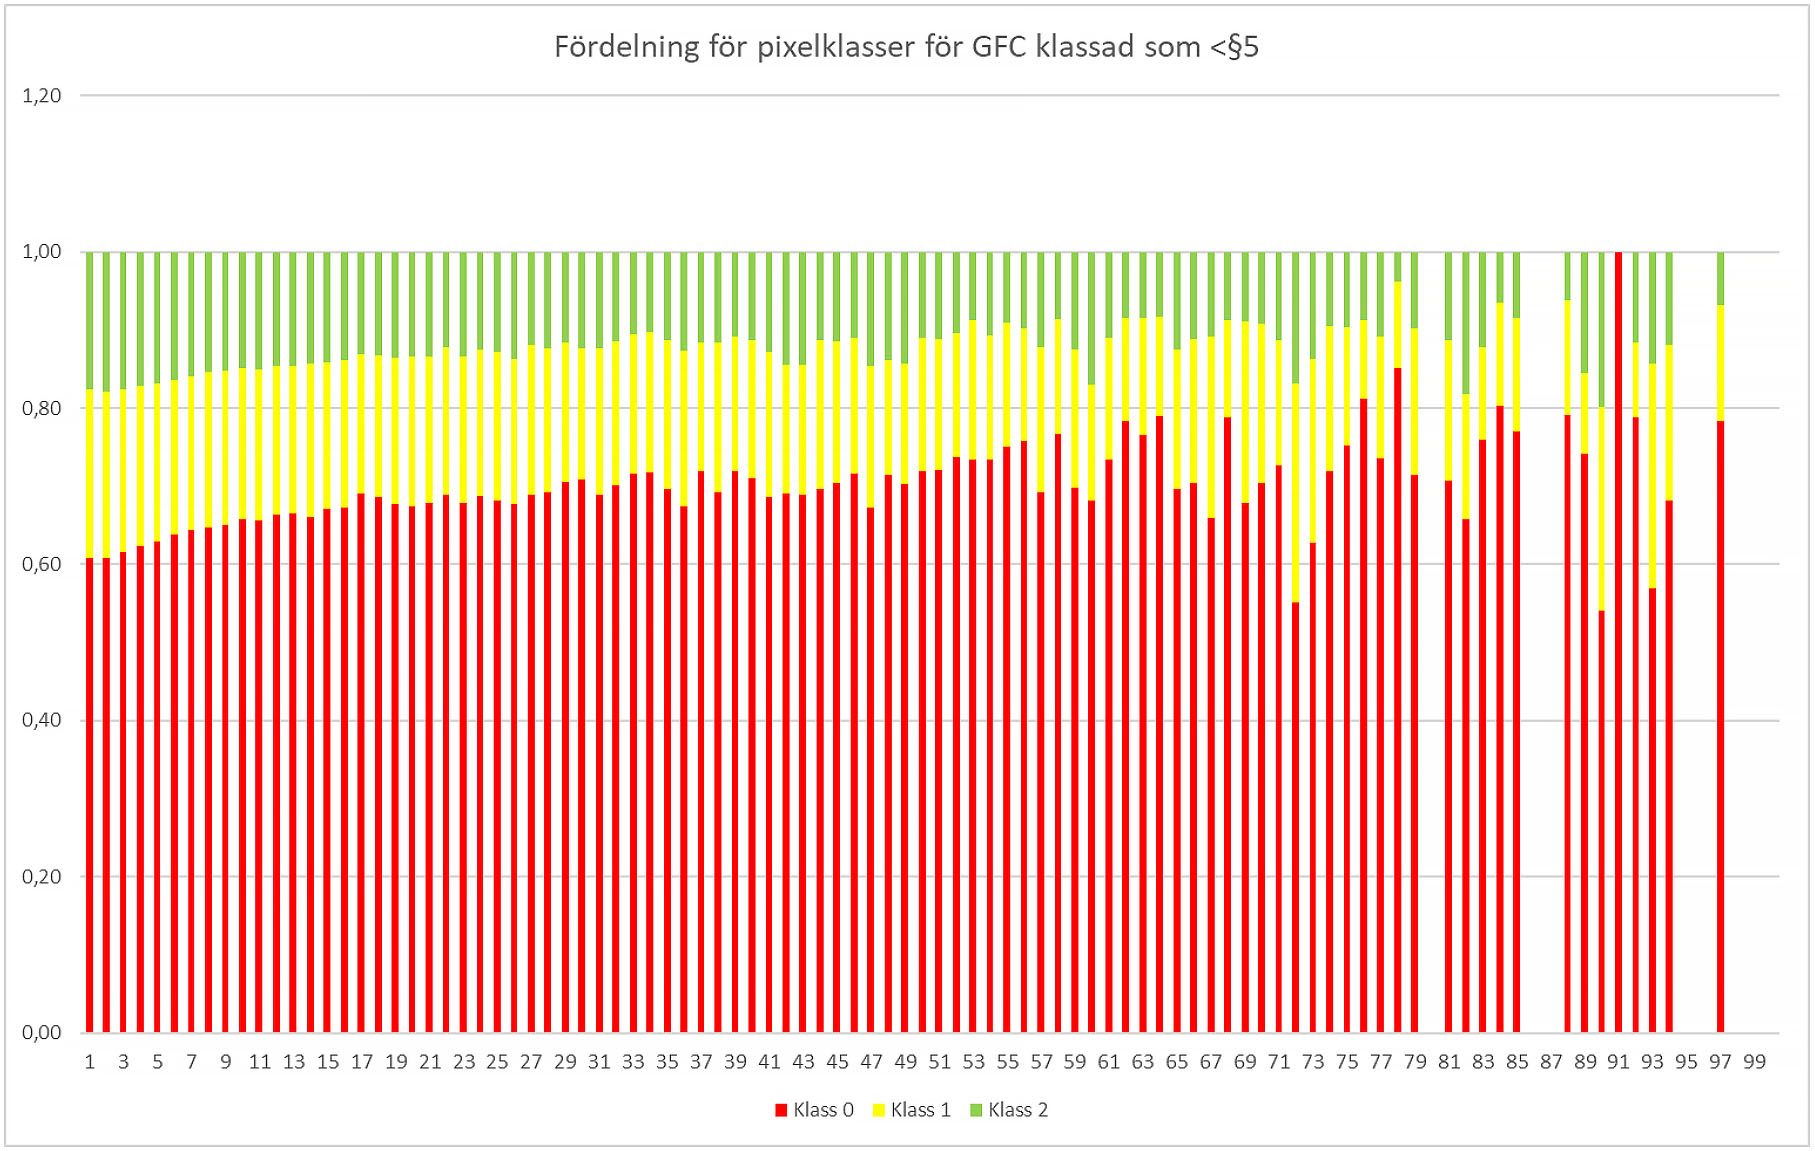
Illustration: Anton Holmström
To check how much JRC/GFC potentially underestimates the area, we made a manual check of 30 sites that were randomly chosen by QGIS. Statistically, we would have needed a larger sample but as that is very time-consuming, we leave that to anyone who wants to go further in checking the GFC data.
The chosen areas are manually and subjectively assessed against aerial photos and Basic Forest Data to determine the actually harvested areas. The result showed an underestimation, that in its turn after being compared with the overestimation above, gives an average overestimation of 11 percent.
The overestimation of 11 percent is deducted from the previously assessed GFC areas under §5 which gives an average harvested forest area for the period (2016-2018) of 213.414 hectares. In addition to this, we have the harvested forest area under §10, 19.552 hectares, and, if we use the same overestimation as for rating class 0, we have a total of 230.990 hectares.
Class Annual average harvested area after adjustment >0,5 hectares
0 213.414
1 17.575
Total 230.990 hectares.
In the analysis, we found 15 percent more felled areas during the period than what the National Forest Inventory found. That is annually about 30.000 hectares more compared to the National Forest Inventory. We choose to add this to rating class 1 as forest under §10 is a forest activity that is obligated to be registered to the Swedish Forest Agency. Looking at detections under §5, GFC finds 6,2 percent more felled areas than the National Forest Inventory. Annually, that is 12.414 hectares.
0,25 or 0,5 hectares in the analyses
The Swedish National Forest Inventory measures harvested forest area sites down to 0,25 hectares size. In our analysis, we have started to measure from 0,5 hectares. An analysis of harvested areas of less than 0,5 hectares has also been done. It shows that approx. 8 percent of the total GFC area, is small, harvested areas less than 0,25 hectares. Approx. 4 percent of the area is between 0,25 and 0,5 hectares.
We have however noted that the uncertainty in the data from JRC and GFC increases with the decreased area. Smaller areas are in other words more uncertain. This has most likely its explanation in the size of the pixels, 30 x 30 meters, which creates an “over bleeding” which affects smaller areas more than large ones.
Discussion about the result
It could be questioned whether the analysis is done with too large safety margins. Theoretically, it excludes 12 percent of the forest area as it only measures sites over 0,5 hectares. The National Forest Inventory should have detected much smaller sites through their sample areas. Furthermore, there are likely but not documented excluded areas as Basic Forest Data started its “second scan” with flight scanning in the summer of 2018. Apart from this, there is a likely underestimation in the fact that the Basic Forest Data detects more area under §5 and §10 compared to what GFC finds.
Through the above-mentioned safety margins, a desirable dimension to the main purpose of this analysis is created – to discuss and analyze the harvested forest area levels in Sweden. All this given the fact that this analysis is a comparison between three years (2016-2018) and not an analysis of the JRC conducted change analysis comparing the periods 2011-2015 and 2016-2018.
Criticism of the JRC analysis argued that as satellite data improved after 2015, more “old” harvested forest areas were found later than in 2015. E.g., satellite data that JRC used to find a new harvested area in 2016 (with the new improved technology) in reality was harvested already in 2014. Because of this, some extra years were included in the analysis but not in the result. In the result of this analysis, no data to confirm this thesis was found.
If you, with help of growing stock in forests that have reached clear-cut age measured by the National Forest Inventory, want a figure of harvested volume for all of Sweden it could correspond to a little less than 3 million cubic meters annually for rating class 0. It’s a blunt figure, but we chose to use it as discussion material. How much it would be if we added rating class 1 is impossible to say. Maybe one can compare our figures with figures from FAO?
The area we are talking about is that data from GFC used by JRC have identified on average (over the three years 2016-2018) a little more than 12.000 hectares of clear-cuts (as defined by the Forestry Act) annually that neither the Forest Agency nor the National Forest Inventory has registered.
Furthermore, 17.000 hectares of potentially too hard thinning or/and sites with nursing trees were found. Areas that could be illegal if they are not registered as clear-cuts. 20.000 hectares of the GFC detections are shown to be potentially inaccurate detections with a detection over §10.
The result on an interactive map
As the project has been completed in the software QGIS we have chosen to export it to a web service that makes it possible for everyone to take part in the result. Before you start searching the map some points are important to clarify:
We have simplified all polygons to make the service faster. You should see a polygon as detection, but you can’t be sure that the polygon is right. When clicking the polygon, you will see the actual size of the area in hectares.
A data set of this size will contain errors. That is partly why we publish the map, simply to make it possible for as many eyes as possible to search polygons and report found errors to us.
The map has a satellite layer from ESRI as a basic map. You cannot conclude that what is shown on the orthophoto corresponds with data from GFC. There could be several years difference between them.
To not reveal single forest owners or risk legal actions, our rating classes are not identified on the map. What you see is all JRC or GFC areas from the specified period (2016-2018) that are forest land larger than 0,5 hectares. That means it could be non-registered felling, and if so illegal, but also a fully legal harvested forest area or even a “hard” thinning that GFC has detected. All JRC data is available in an interactive map by GFC.
In our analysis, but not in public, we have comparisons to the Forest Agency’s GIS. Here differences are obvious where our analysis found harvested forest areas that are not registered by the Forest Agency.
Considerations as a summary
It’s annoying that our result doesn’t correspond better to the harvested area that the National Forest Inventory presents. It should. The reason for any errors is difficult to guess, but different types of average values in the Forestry Inventory’s figures could be one reason. Apart from this, we have divided our considerations into subheadings:
A. Improvement potential at the Swedish Forest Agency?
After spending time with this amount of data, the question occurs why the Forest Agency doesn’t have better public data. As an authority, responsible for both the Forestry Act and the Timber Act, the Forest Agency should have the best data available. Unfortunately, that doesn’t seem to be the case. Added to that it’s worth mentioning that they are using Sentinel satellites to find clear-cuts. Sentinel has with its smallest pixels a possible resolution of 10 x 10 meters which is three times better than Landsat, which is used by JRC and GFC, and our analysis.
One example is shown in the GIF image below. It’s two images of a randomly chosen area in Sweden shifting between GFC data and data from the Forest Agency. Here, the Swedish Forest Agency should have the best control through data from Sentinel. Instead, it seems that GFC is most right with data from Landsat compared to orthophotos. Smaller clear-cuts and thinnings are not registered, and only parts of a registered and felled clear-cut are marked as “harvested”.
Given that our analysis could be considered “fair” and that we only have included GFC detections of over 0,5 hectares, and only on forest land, the data from the Forest Agency should theoretically show a larger felling area than we have found. Instead, data shows that our GFC analysis has detected up to 40 percent more felled area than the Forest Agency.
B. Why hasn’t this analysis been done before?
Instead of making this analysis from scratch, we would have preferred to review a similar analysis made by someone else. Strangely, there seems to be no such analysis published before. We have used open data, available for everyone, also for authorities and universities.
Unlike us, those parties have access to several GIS specialists. Maybe it’s naive to think this has never been done before. If it has, why wasn’t it published?
C. JRC and Sentinel?
In the latest reply, JRC writes that data from Sentinel satellites could be right to use for remote measuring of forests. Most likely they are right and are already underway with a new analysis with Sentinel data. This is satellite data with higher resolution and higher frequency. Maybe it’s time for Sweden to present its own comparisons before the critics do. The Swedish Forest Agency already uses Sentinel data and could probably easily analyze Sweden.
The carbon as value raises the stakes
Why care about this and why have we made this analysis? Signs are showing that the global climate issue and the situation with too high concentrations of carbon in the atmosphere will partly be solved through a market economy. From a forest owner’s perspective, there could be financial benefits if the forest measuring is done as accurately as possible.
Furthermore, forest data such as harvest levels, growth, and outgoing are nowadays “high value”. Reports to, e.g., the UN based on the Kyoto protocol and the Paris agreement are based on data about growth and harvest in the forest. So are forecasts like the Swedish “SKA22” too. Our politicians make decisions based on this data and it’s used daily in the debate. It must be as accurate as possible.
Another reason could be that demands from external powers, like the EU, can increase if it turns out that remote measuring via satellite gives better data than today’s common methods. As the climate issue must be solved, it’s not unlikely that Sweden as a nation will be adjusted by e.g., LULUCF figures because of this. “As usual”, the state and the industry make the planning, and the taxpayers and/or single forest owners that have accidentally harvested too much must pay. And we haven’t even mentioned violations of the Timber Act.
There are also other reasons why we made this analysis. We hope that it will be challenged, questioned, and discussed. That way we can reach development and create a better future for all of us. If the analysis should be challenged, it must be properly. We will not accept rebuttal without a good background, such as another analysis.
Given the safety margins we have used, together with the result of our analysis, hints are saying that more forest area is felled in Sweden than the official statistics claim. It’s interesting and we hope that the analysis gives fuel to the debate.
Technical deepening
The JRC article was based on their own remote analysis of all the EU forests. JRC has used data from the University of Maryland and WRI’s Global Forest Watch. The data used is called GFC – Global Forest Change, data that is based on NASA’s LANDSAT satellites. This data is free for anyone to use and is thus the data we have used in our analysis.
Satellite data in this context uses light, both visible and invisible, to take pictures of the face of the earth. The satellites circle in orbits approx. 700 kilometers above ground and can cover the earth in 16 days. There are problems with clouds and the Landsat satellites have in the GFC data a relatively low resolution of 30 x 30 meters per pixel.
Researchers from Sweden and Finland have responded to the JRC articles by using data from the National Forest Inventory. The Swedish National Forest Inventory uses both randomly chosen and fixed sample areas throughout Sweden. Here we are talking about manual work where some 15 teams annually inventory the approx. 13.000 sample areas of a total of 130 hectares.
The Basic Forest Data is a map that the Swedish University of Agricultural Sciences and the Swedish Forest Agency create from laser data and the National Forest Inventory’s sample areas. Laser data is collected by airplanes equipped with measuring lasers flying over the country “shooting” millions of laser beams on the face of the earth that bounces back at different times. The result is cloud-free data with high-resolution pixels with specified heights. This data is used to create the digital product “Basic Forest Data”. Approx. 60 percent of the Swedish forest area is for the moment available in the latest series called “the second scan”.
Apart from this, the Swedish Forest Agency has map data showing harvested areas, which is a combination of satellite data analysis and manual interpretation to see when a registered area is being harvested and to what extent. We also asked for unidentified map polygons for historical felling registrations.


